
Lens, a Chrome DevTools extension
See inside a Pega Constellation app.
Lens records every PCore call, PConnect call, store change and network request your app makes, right inside DevTools. Stop guessing what your component received. Look.
Nothing runs on a site until you switch it on for that site.

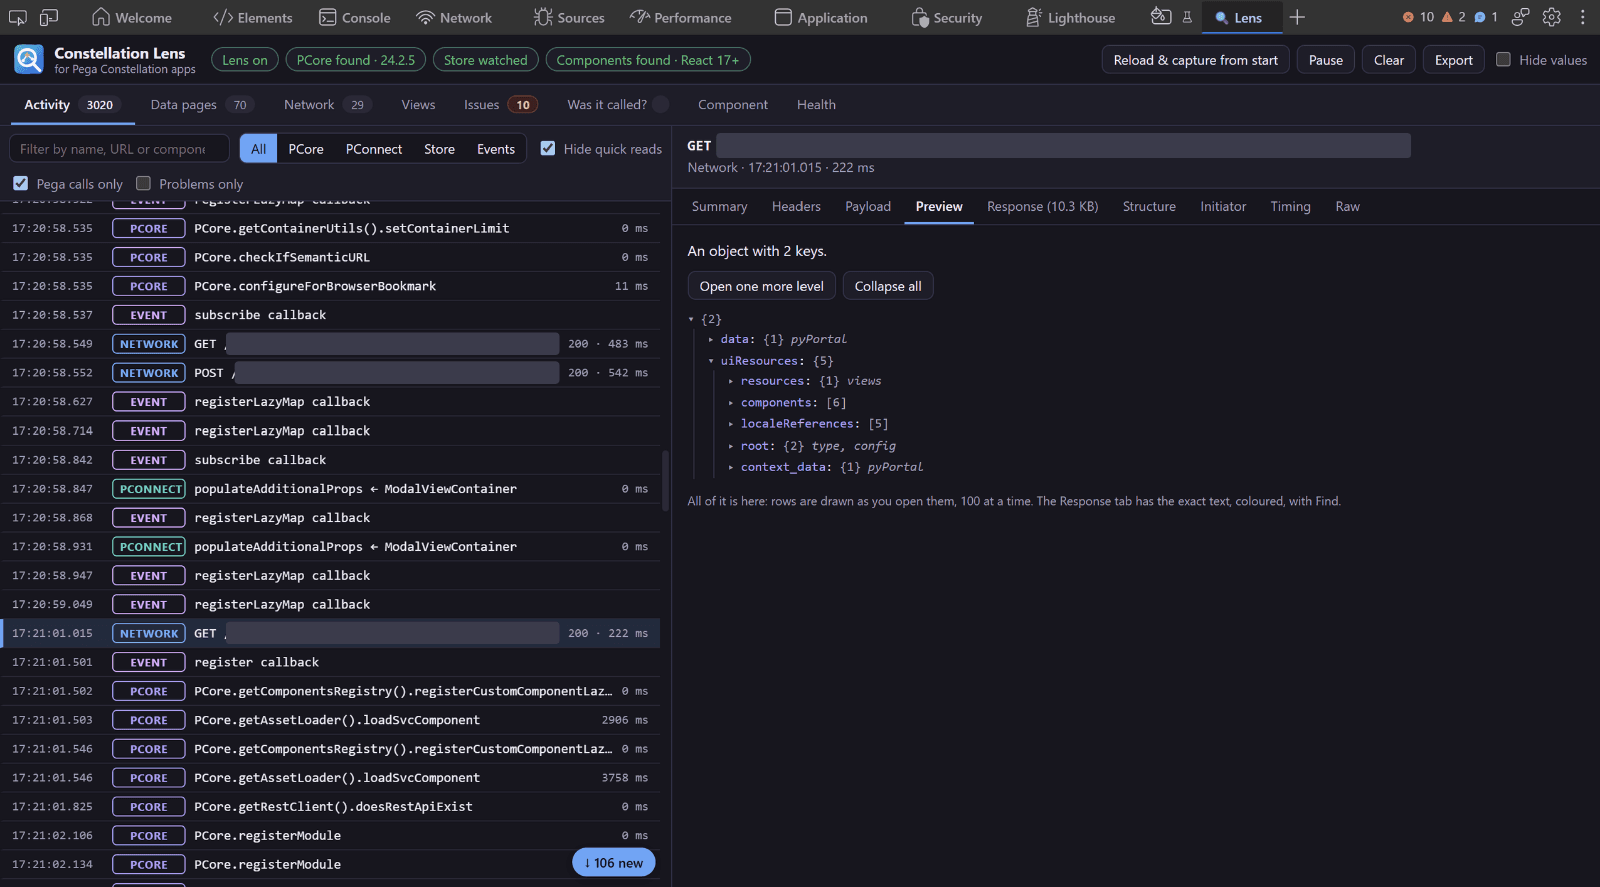
Step 1 of 8
Add it to Chrome
Install Lens from the Chrome Web Store with one click. Illustrative data.
- What was called
- Which API, from which component, with exactly which arguments.
- What came back
- The full response, not a summary, with how long it took.
- What shape it has
- Every field and its type, with the optional ones marked.
Everyday use
Speed up debugging on Constellation.
Find what a component received
Pick it on the page and read its config props, state props and case info, exactly as Pega handed them over.
Read a data page’s output
See the parameters it was called with, every row and column it returned, and the HTTP request behind it.
Catch the very first calls
Reload and capture from the start, so the requests made before you opened DevTools are not missed.
Spot a loop or a slow call
Loops, slow requests and errors are collected in one list, with how often and when each happened.
Copy a finding into a ticket
Copy any issue as Markdown or JSON, or download a .md file, ready to paste.
Share a screenshot safely
Hide values to show structure only, so a screenshot or a report leaks nothing.
What it shows
Six things, one panel.
Network, like the browser’s own
Headers, Payload, Preview, Response, Initiator and Timing for every request. The Response is coloured and numbered, with Find. Bodies are kept in full.
Data pages
Every call that loads data, with its parameters, rows, columns and the HTTP request it made.
Views inside views
The mounted components as a tree, and a picker to choose one by clicking it on the page.
Issues you can copy
Failed calls, page errors, console errors, slow requests and loops, each copyable as Markdown or JSON.
Component details
Config props, state props, case info and metadata, and the structure of each.
Safe to share
Hide values to show structure only, so a screenshot or a report leaks nothing. Sensitive headers stay hidden until you ask.
On a real app
A quick walkthrough.
Follow the numbers on each screenshot to see what every part does. Captured on a live Pega Constellation app (Pega 24.2.5). The app’s name and address are blacked out, and its data page names are replaced with generic ones.
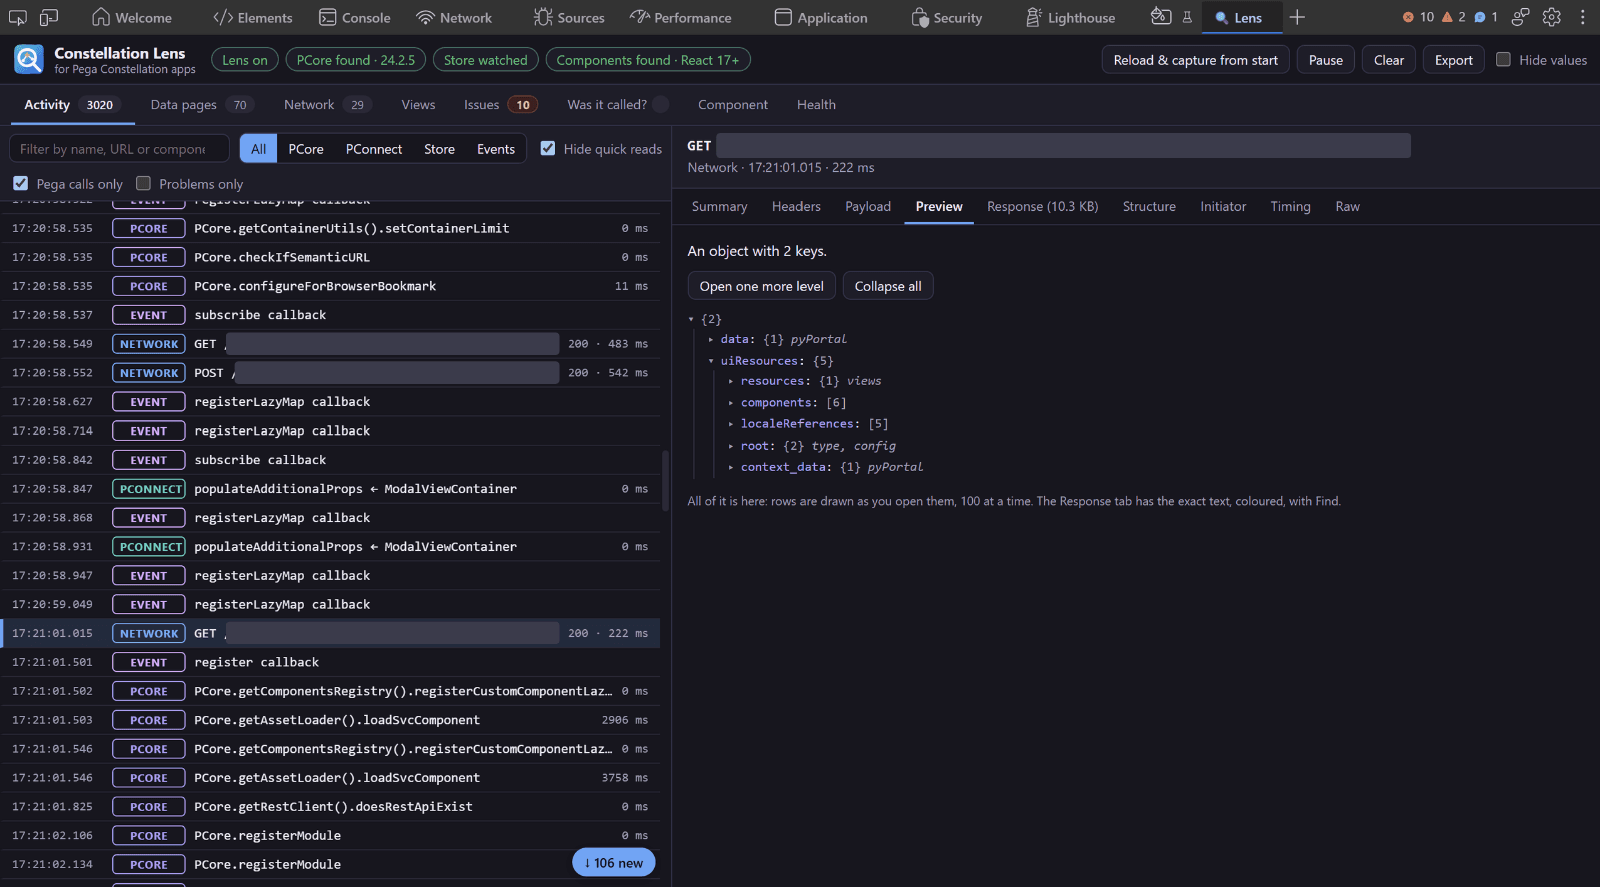
- The tabs. Each tab answers a different question. The number is how many things it holds.
- Filter. Narrow to PCore, PConnect, the store or events, or type a name or a URL.
- The timeline. Every call in order: its kind, its name, and how long it took.
- Click one for the detail. Summary, Headers, Payload, Preview, Response, Structure, Initiator and Timing for the selected call.
- Hide values. Shows structure only, so a screenshot or a report leaks nothing.
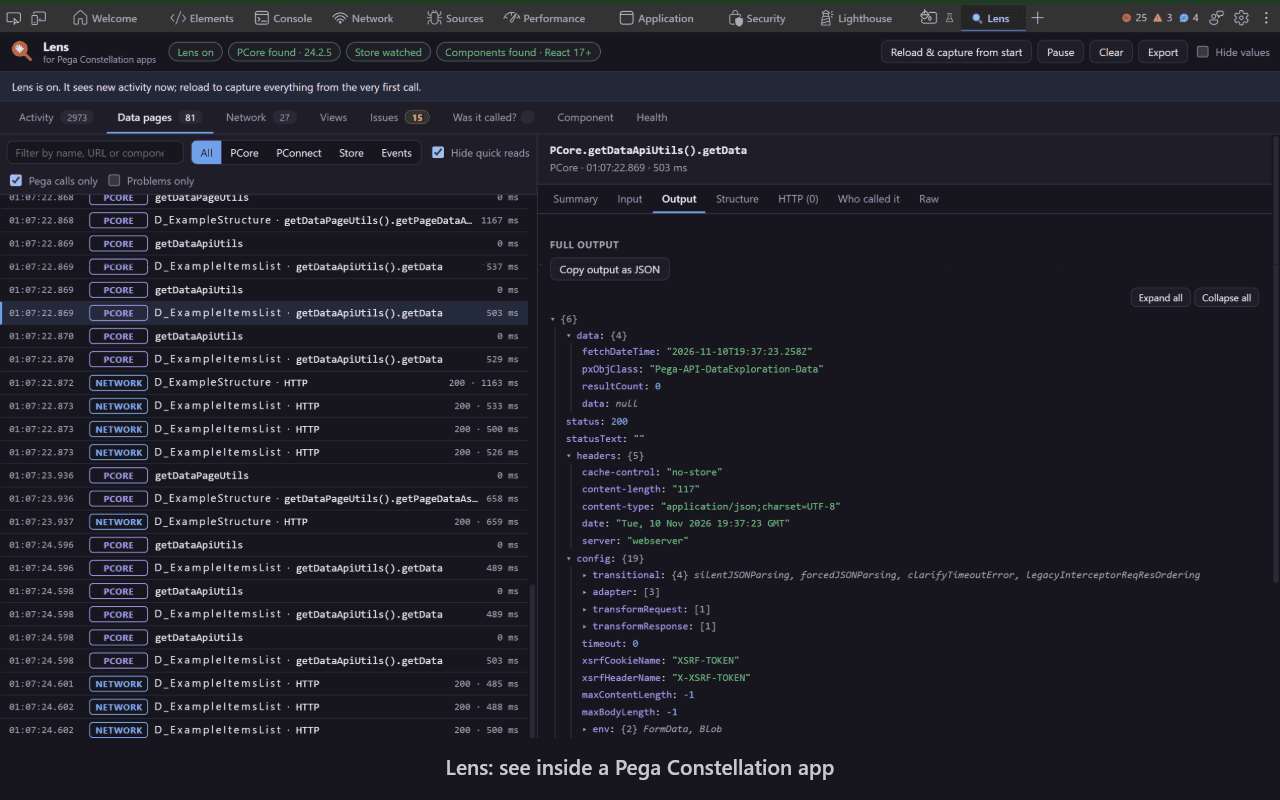
- Data pages. Only the calls that load data, with a count of how many.
- Each call. The data page, the kind of call, and how long it took.
- Its tabs. Summary, Input, Output, Structure, the HTTP request behind it, and who called it.
- Copy it as JSON. One click copies the exact output.
- The full output. Everything it returned, as a tree you can expand and collapse.
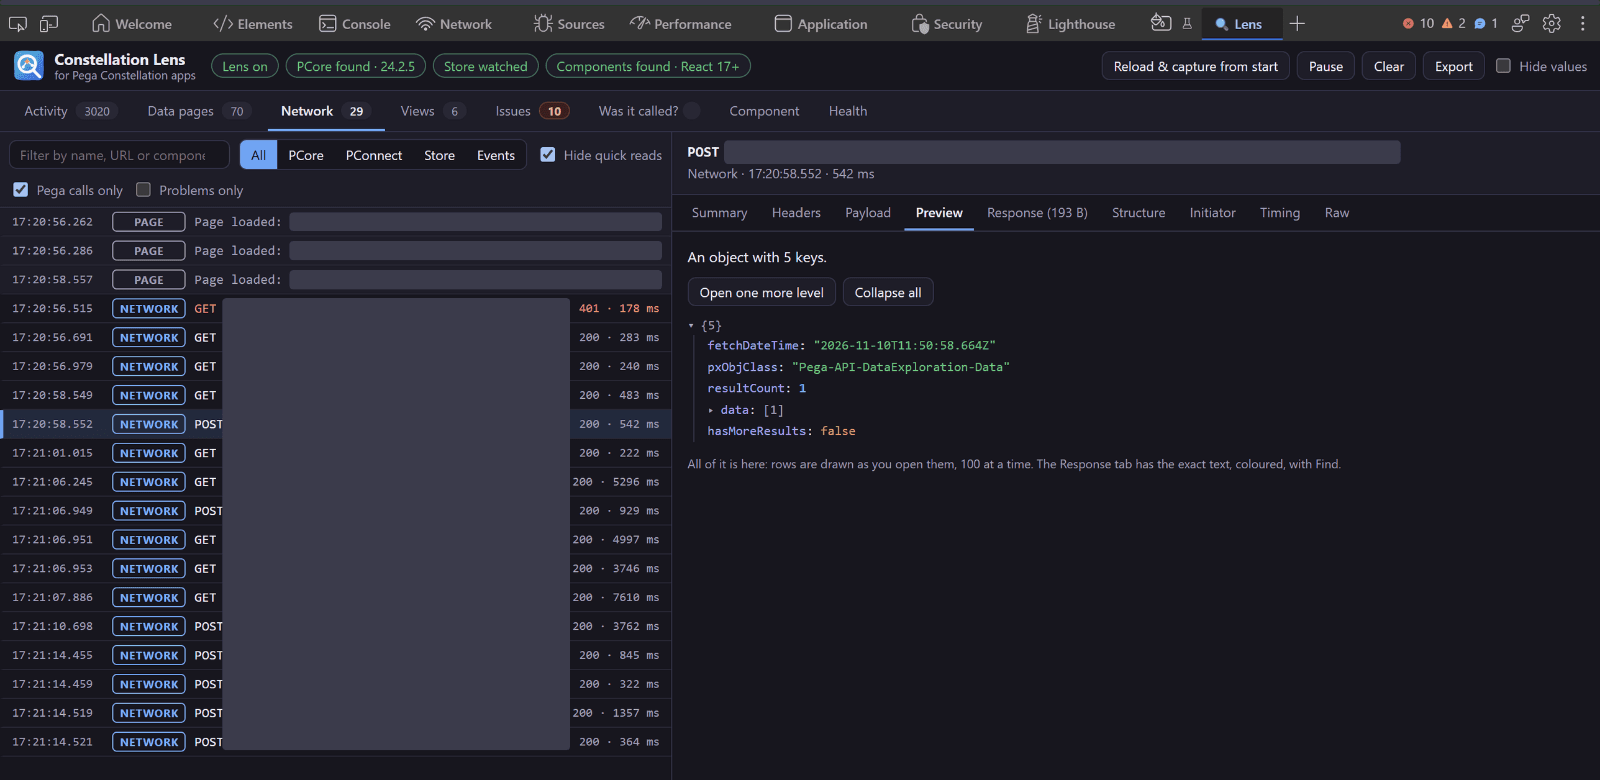
- Network. Every request the page makes, like the browser’s own panel.
- The requests. Method, status and time at a glance. Failures stand out.
- One request, in full. Headers, Payload, Preview, Response, Structure, Initiator and Timing.
- Preview. The response drawn as a tree. Open a branch to read it.
- Reload & capture from start. Records the page’s very first calls, not only what happens after you open Lens.
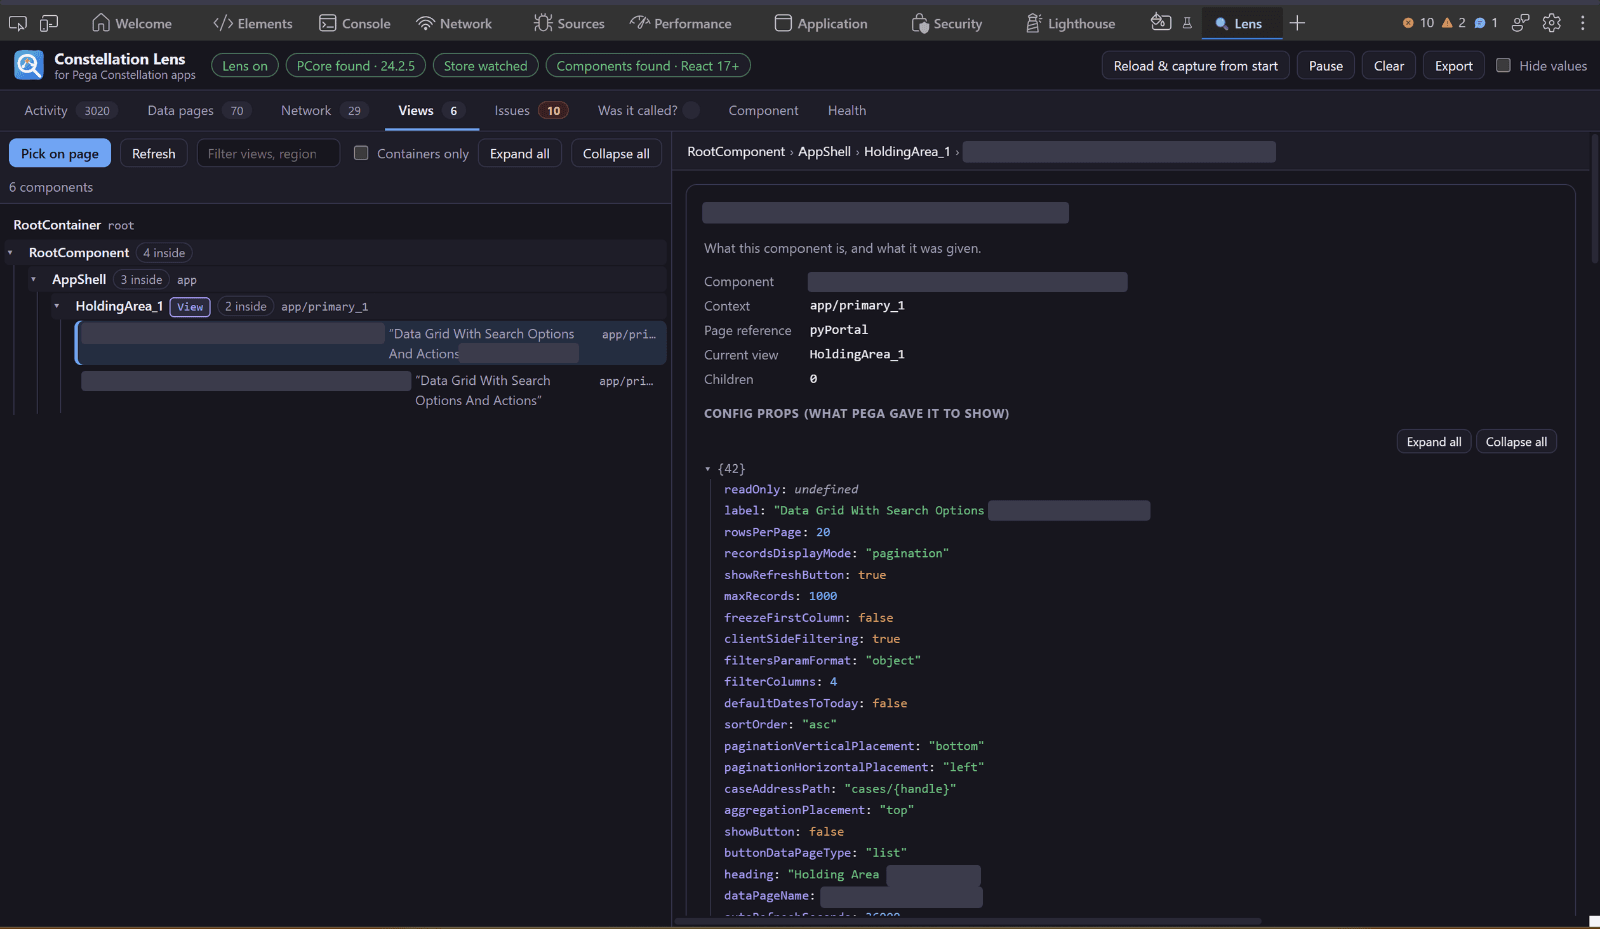
- Views. The components mounted on the page, found through React.
- Pick on page. Click any element on the page to jump straight to its component.
- A tree of views. Views inside views, nested, with how many components each one holds.
- Where you are. The path from the root to the selected component.
- Config props. Exactly what Pega gave the component to show.
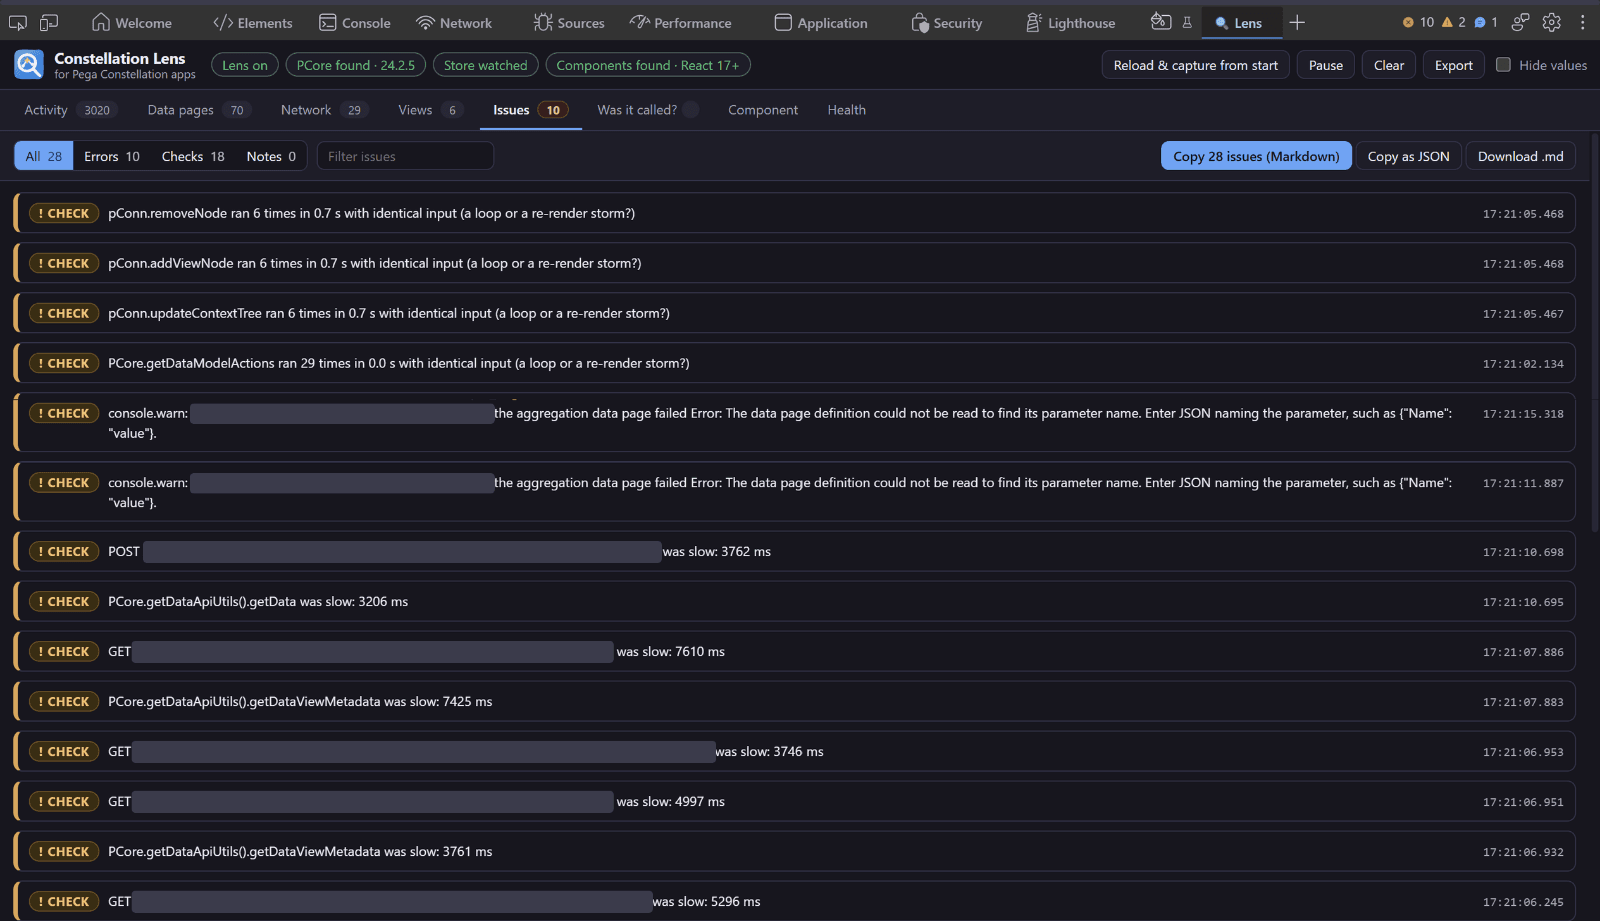
- Issues. Everything worth a look, with a count.
- Filter by severity. All, Errors, Checks or Notes.
- Each finding. What happened, how often, and when. Here, a loop or re-render storm.
- Copy it. As Markdown or JSON, or download a .md file, ready to paste into a ticket.
Install
Three steps.
- 1Download the zip from the latest release and unzip it somewhere permanent.
- 2Open chrome://extensions, switch on Developer mode, choose Load unpacked, and pick the folder.
- 3Open your Pega app, open DevTools, go to the Lens tab, click Turn on for this site, then reload.
Nothing runs on a site until you switch it on for that site.
Safety
Stay in control.
Everything stays in your browser. No server, no analytics, no tracking. Read the privacy policy.
Built in
You choose the site
Nothing runs on a site until you switch it on for that site.
It stays in your browser
No server and no analytics. What it records goes nowhere else.
Hide values
Show structure only. Sensitive headers stay hidden until you ask.
Habits that help
Hide values before you share
Turn it on before a screenshot, a recording or a report.
Read a copy before you paste it
A copied issue can hold real data. Check it before it goes into a ticket.
Mind the environment
Prefer a test environment when you can, so real data is not in the panel at all.
Questions
FAQ.
What is Lens?
A Chrome DevTools extension for Pega Constellation apps. It records the PCore, PConnect, store and network calls your app makes and shows what each was given and what it returned.
Does it send my data anywhere?
No. There is no server and no analytics. What it records is shown in the DevTools panel for the same tab.
Does it run on every site I visit?
No. Nothing runs on a site until you click Turn on for this site in the Lens tab, then reload.
How do I install it?
Add it from the Chrome Web Store, or download the zip from the latest release and load it unpacked. The steps are above.
Is it affiliated with Pegasystems?
No. Lens is an independent project. Pega and Constellation are trademarks of their owner.